Power
Analysis - Role of Alpha
The significance
test yields a p-value that gives the likelihood of the study effect, given
that the null hypothesis is true. For example, a p-value of .02 means
that, assuming that the treatment has no effect, and given the sample
size, an effect as large as the observed effect would be seen in only
2% of studies.
The p-value
obtained in the study is evaluated against the criterion, alpha. If alpha
is set at .05, then a p-value of .05 or less is required to reject the
null hypothesis and establish statistical significance.
If a treatment
really is effective and the study succeeds in rejecting the null, or if
a treatment really has no effect and the study fails to reject the null,
the study's result is correct. A Type I error is said to occur if the
treatment really has no effect but we mistakenly reject the null. A Type
II error is said to occur if the treatment is effective but we fail to
reject the null.
Assuming
the null is true and alpha is set at .05 we would expect a type I error
to occur in 5% of all studies - the Type I error rate is equal to alpha.
Assuming the null is false (and the true effect is given by the effect
size used in computing power) we would expect a type II error to occur
in the proportion of studies denoted by one minus power, and this error
rate is known as beta.
 If
our only concern in study design were to prevent a Type I error it would
make sense to set alpha as conservatively as possible (e.g. at .001).
However, alpha does not operate in isolation. For a given effect size
and sample size, as alpha is decreased power is also decreased. By moving
alpha from (say) .10 toward .01 we reduce the likelihood of a Type I error
but increase the likelihood of a Type II error. If
our only concern in study design were to prevent a Type I error it would
make sense to set alpha as conservatively as possible (e.g. at .001).
However, alpha does not operate in isolation. For a given effect size
and sample size, as alpha is decreased power is also decreased. By moving
alpha from (say) .10 toward .01 we reduce the likelihood of a Type I error
but increase the likelihood of a Type II error.
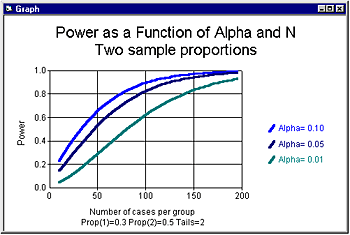
Figure 2
shows power as a function of sample size for three levels of alpha (assuming
an effect size of 30% vs. 50%, which is the intermediate effect size in
the prior figure). For the most stringent alpha (.01) an N of 139 per
group is required for power of .80. For alpha of .05, an N of 93 per group
is required. For alpha of .10, an N of 74 per group is required.
Traditionally,
researchers in some fields have accepted the notion that alpha should
be set at .05 and power at 80% (corresponding to a beta of .20). This
notion is implicitly based on the assumption that a type I error is four
times as harmful as a type II error (the ratio of alpha to beta is .05
to .20), which notion has no basis in fact. Rather, it should fall to
the researcher to strike a balance between alpha and beta as befits the
issues at hand. For example, if the study will be used to screen a new
drug for further testing we might want to set alpha at .20 and power at
95%, to ensure that a potentially useful drug is not overlooked. On the
other hand, if we were working with a drug that carried the risk of side
effects and the study goal was to obtain FDA approval for use, we might
want to set alpha at .01 while keeping power at 95%.
Previous | Next
| 


