Survival Analysis Overview
Major innovation in computational speed
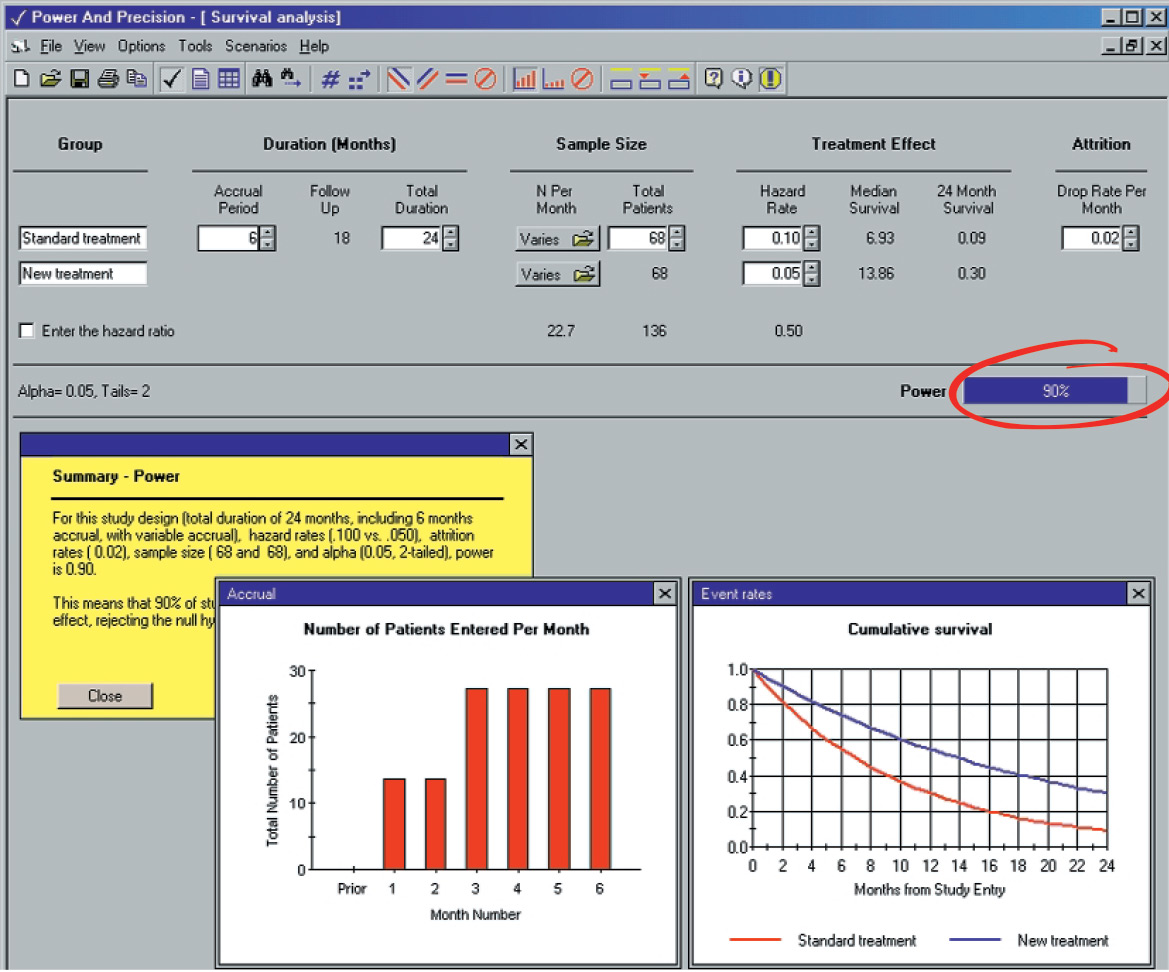
Compute power by formula rather than simulation even when accrual rates, hazard rates, and attrition rates vary from one time interval to the next.
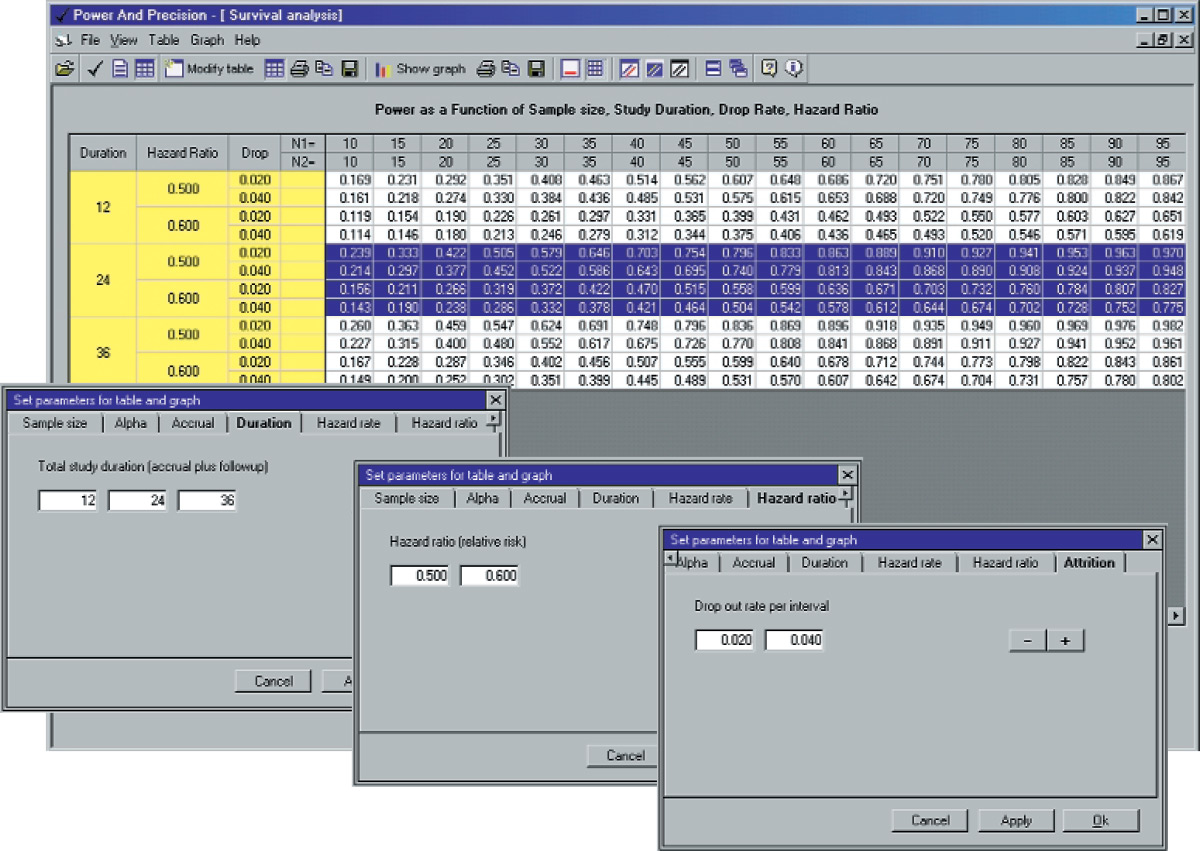
Graph power as a function of study duration, accrual patterns, treatment effect, attrition, or any other parameter in just seconds and get a clear picture of that factor's impact in your study.
This speed is made possible by the new algorithm which bypasses the simulation, coupled with an extremely powerful interface. With any other program, the same task would require many hours of tedious computation.
Work interactively!
- Modify the accrual, follow-up, sample size, hazard rates, attrition, or any parameter...and immediately see the impact on power.
- Or, click “Find N” and the program will find the sample size automatically.
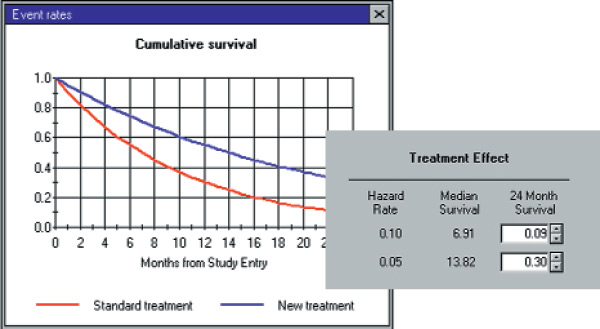
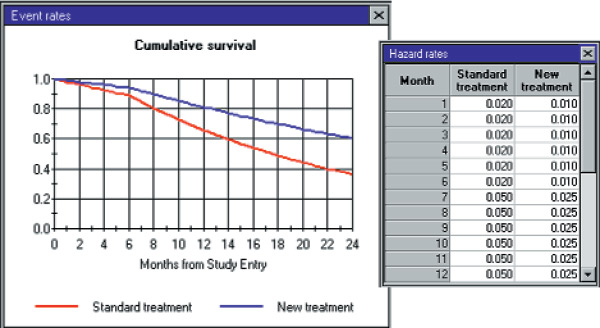
- The graph of cumulative survival serves as a clear and compelling picture of the treatment effect.
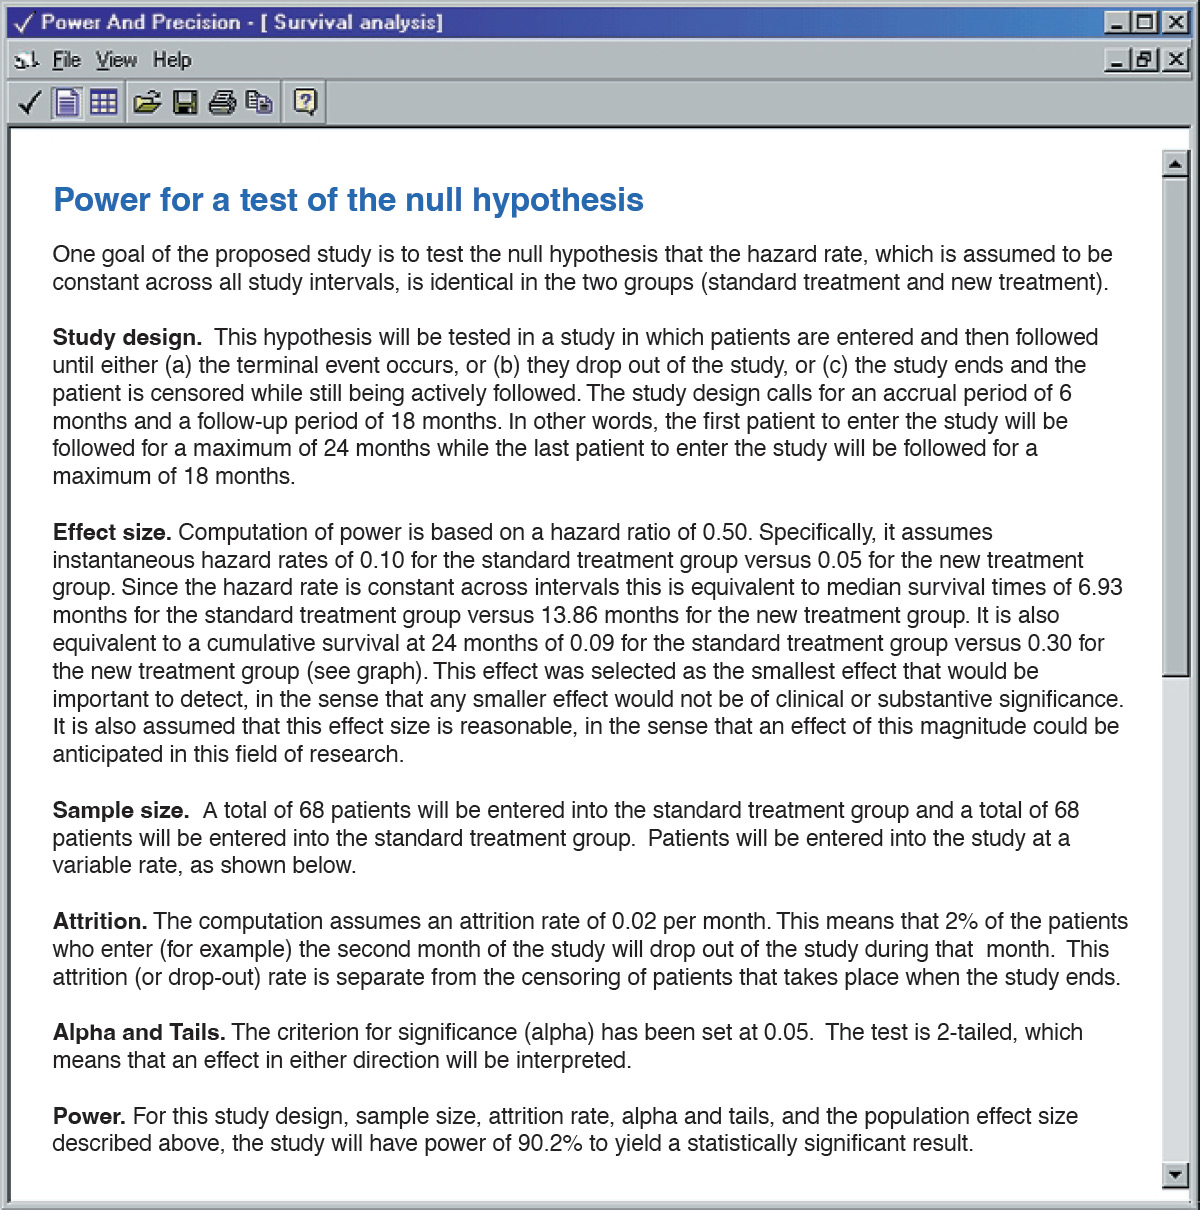
Create A Report with a Single Click!
- CREATE a report which explains the study design and assumptions.
- VERIFY that all elements of the study have been specified correctly.
- USE the report as a teaching tool, and as an example of how a power analysis should be described.
- EDIT the report and include it in your study plan or grant application.
- The report is shown unedited. The group names (New treatment), time interval (months), and subject type (patients) are based on user-set preferences.
Enter the treatment effect using a seamless interface— the graph of cumulative survival is updated automatically.
Assess the impact of all parameters in just seconds!
- Click “Tables and Graphs.”
The program picks up all
parameters from the main
screen and uses these to
select a plausible range of
values for the sample size.
The initial table and graph
are created immediately.
Total time: 1 second - Add any number of factors
with a few clicks. Here, we
will use three levels of
duration (12, 24, 36
months), two levels of
treatment effect (risk
ratio of .50 and .60), and
two rates for attrition
(.02 and .04). The
program automatically
nests the factors,
populates the table, and
creates the graphs.
Total time: 20 seconds
Simply drag and drop columns in the table to instantly highlight the impact of any parameter. For example...
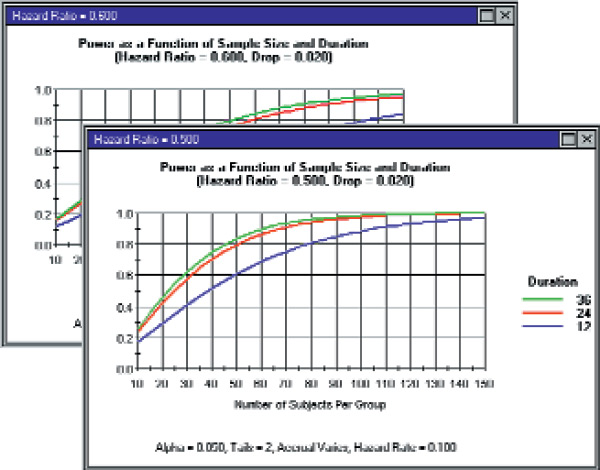
Power increases substantially as duration is increased from 12 to 24 months, but there is virtually no impact on power if the study duration is increased beyond that point.
Total time: 1 second.
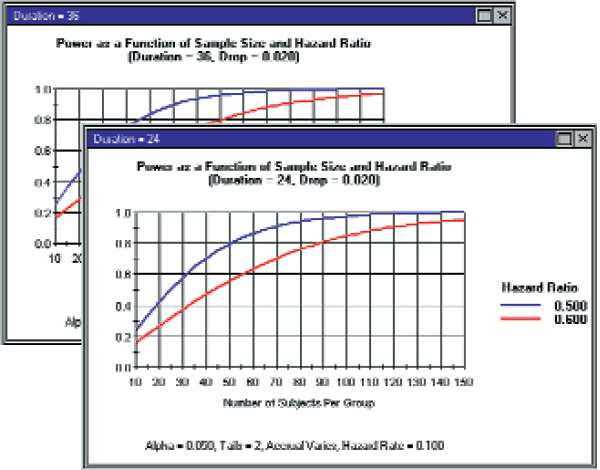
If we elect to plan for the smaller treatment effect we will need to increase the sample size by 40 patients per group. This is true for a 24 month study (foreground) or 36 months (background).
Total time: 1 second.
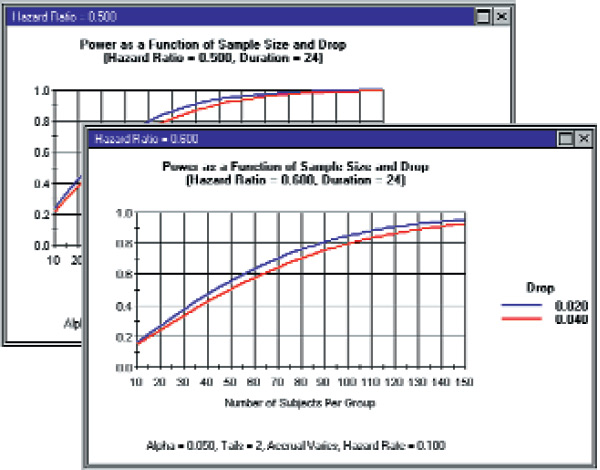
In this example, an attrition rate of 4% per month as compared with 2% per month will have only a modest impact on power. This holds true across all levels of treatment effect and duration.
Total time: 1 second.
Use with these graphs at meetings to develop an appropriate study plan.
Include the graphs in your reports and grant applications.

"This is stunning in its clarity and efficiency."
Dr. Sal Mannuzza - New York University School of Medicine
Power and Precision

Power and Precision is a statistical power analysis software package for calculation of a sample size for a planned study. The program features an unusually clear interface, and many tools to assist the user in developing an understanding of power analysis.
