An Illustrative Usage Example
Assume that you are planning a study to compare the proportion of patients responding to two treatments. Patients will be randomly assigned to either the standard treatment or a new treatment.
The standard treatment has a response rate on the order of 40% and the new treatment would be considered useful if it increased the response rate to 60%. What sample size is required to yield power of 90%?
The following steps, which correspond to panels at left, show how you would use the program to quickly compute power and prepare a report and graphs.
Step 1
Select the module for two independent proportions- Enter names for the two groups.
- Enter the response rate for each group (60%, 40%)
- Click on Alpha and select a value (.05)
- Click “Find N” for power of 90%
- The program shows that 130 subjects per group will yield power of 90%
Step 2
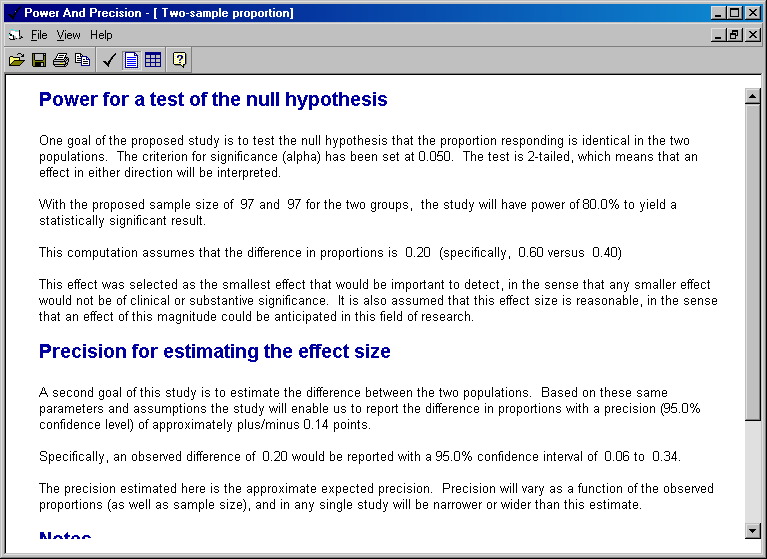
Click “Make Report” to create the report shown. Copy to clipboard and export to Word® or other word processing program.
Step 3
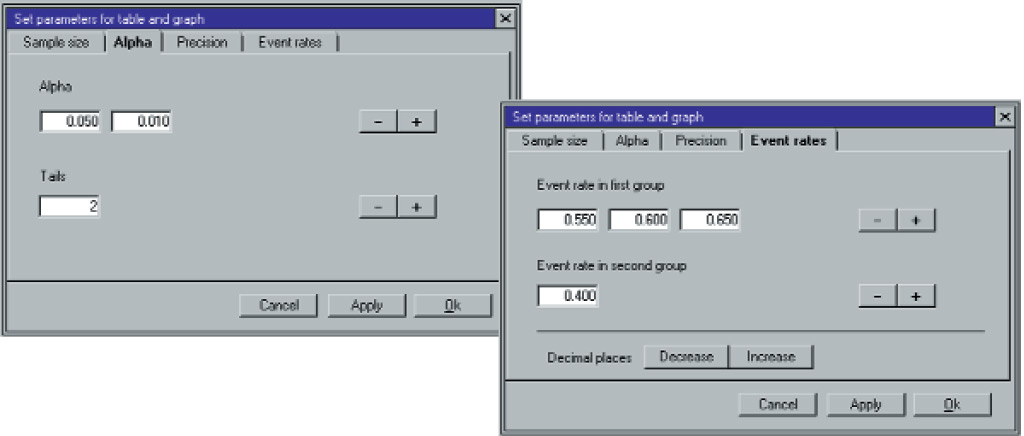
Click “Make Table” to create the table and graphs. The program picks up the effect size and alpha from the main screen and uses these to automatically select a range of plausible values for sample size. The initial table and graph are created immediately.

Add factors to the table and graphs in seconds! Open the wizard (below), add one or more factors, and click OK. The program automatically nests the factors, adds titles to the tables and graphs, creates legends, sets a new range for the sample size—in an instant.

Pivot the tables and graphs! To modify tables simply drag and drop the columns. All elements of the graphs, including titles and legends, are modified automatically as well.
Export the report, table and graphs to your word processing program and include then in your study plan or grant application.

"Your software is superb!"
Dr. David Noble - University of Aberdeen
Power and Precision

Power and Precision is a statistical power analysis software package for calculation of a sample size for a planned study. The program features an unusually clear interface, and many tools to assist the user in developing an understanding of power analysis.