Features
Working With Results
Tables- Print directly
- Copy to clipboard as data and insert into Microsoft Excel® or other spreadsheet New!
- Copy to clipboard as a bitmap and insert into Microsoft Word® or other word processing program
- Print directly
- Copy to clipboard as data and insert into Microsoft Word® or other word processing program
- Export as bitmap (BMP), Windows Metafile (WMF) or Windows enhanced Metafile (EMF) and insert into Microsoft Word®, PowerPoint® or other programs New!
- Save as RTF file or copy to clipboard and insert into Word® or other word processing programs.
- Print directly
- Copy to clipboard as data and insert into Microsoft Excel® or other spreadsheet New!
- Copy to clipboard as a bitmap and insert into Microsoft Word® or other word processing program
- Pivot the tables interactively New!
- Display several graphs at once to assess the impact of factors
in isolation or in combination with each other. New! - Graphs are linked to the tables.
Drag and drop columns in table, and the graphs are updated as well. New! - Graphs can be saved as BMP, WMF, EMF files and easily exported to Word, PowerPoint, and other programs. New!
- Tabulate and graph precision (confidence interval) and standard error as well as power for proportions and means.
Tools and Features
- Find the sample size for a given level of power
- Assign subjects to groups using allocation ratio
- Store and restore any set of parameters
- Apply Cohen's effect size conventions
- Store scenarios to list (sensitivity analysis)
- Customize the spin control for sample size
- Customize data entry
- Set alpha and tails, link to confidence interval
- Customize the number of decimals displayed
- Display power using digits or bar graph
Statistical Procedures
t-tests and z-tests- One group against a null of zero
- One group against a user-specified null
- Paired/change against a null of zero
- Paired/change against a user-specified null
- Two independent groups, enter difference score
- Two independent groups, enter mean for each group
- One group against a null of 50%
- One group against a user-specified null
- Two independent groups (Eight computational options for power including Fisher exact test. Indices include risk difference, relative risk, and odds ratio).
- McNemar test of paired proportions
- KxC test of independent proportions*
- Sign tests
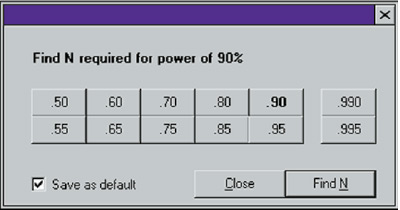

FIND THE SAMPLE SIZE AUTOMATICALLY. Click “Find N” and the program displays the sample size required for any level of power. You may specify an allocation ratio (e.g., 2:1) which will be honored in all computations.
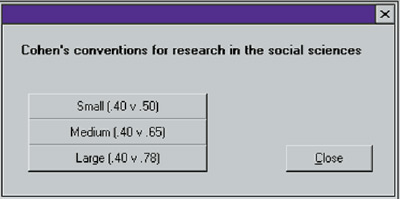

CONVENTIONS FOR EFFECT SIZE. If you cannot estimate an effect size, use Cohen’s conventions for small, medium, and large effects. Even when you can estimate an effect size, compare it with these values to ensure that your values are realistic.
- One group against a null of zero
- One group against a user-specified null*
- Two groups*
- One way analysis of variance/covariance
- Two way fixed effects factorial anova/ancova
- Three way fixed effects anova/ancova
- Templates for common designs including covariates followed by main effects; main effects followed by interactions; dummy-coded variables; and polynomial regression
- Customize the design with up to 10 sets of variables and up to 99 variables per set
- Computes power for the increment to R-squared at each step and also for the cumulative R-squared at each step
- Compute power for sequential sets combined
- One continuous covariate
- Two continuous covariates, one partialled
- Two continuous covariates combined
- One categorical covariate up to 5 levels
- Accrual options - Prior to study, constant rate, or varies
- Hazard - Constant rate or varies
- Attrition (Drop-outs) - None, constant rate, or varies
- Proportions*
- Means
- Compute power using the non-central t distribution, non-central F, or non-central chi-square distributions
- Compute power for all procedures
- Compute precision (expected width of confidence intervals) for t-tests, z-tests, one sample proportions, two independent sample proportions, and one sample correlation
- Compute tolerance intervals for t-tests
- Includes exact algorithms for all procedures except where noted by (*).
Help and Technical Support
Within the Application- Interactive guide - alerts you to the program’s features and offers suggestions for increasing power
- Continuous summary - provides a running commentary on the current state of the analysis.
- Tip of the day
- Windows Help System including Table of Contents, Index, Step-by-Step Help
- Technical support by e-mail or phone
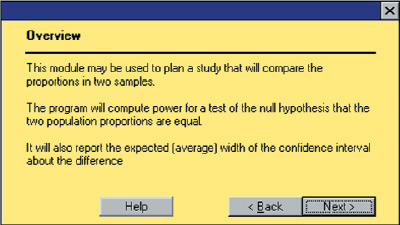

INTERACTIVE GUIDE. This guide alerts you to the program’s features and offers suggestions for increasing power.
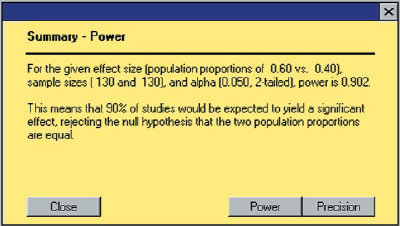

CONTINUOUS SUMMARY. This panel provides a running commentary on the current state of the analysis.
PDF manual
The manual explains the logic and proper application of power analysis. It also includes worked examples for each statistical procedure, and details for all algorithms. An extensive Help system provides step-by step instructions for each procedure.

"In summary, this software was obviously developed by those who have conducted power analyses for numerous proposals. The authors are well aware of the "What ifs?" that we are asked, and that we ask of ourselves, as we conduct power analyses as a part of planning trials. With its great flexibility and speed, this nicely designed software would be well used by anyone involved in the design of clinical trials and other research projects."
Dr. Andrew Leon - Software Review, Controlled Clincal Trials, 20:202-204 (1999)
Power and Precision
Power and Precision is a statistical power analysis software package for calculation of a sample size for a planned study. The program features an unusually clear interface, and many tools to assist the user in developing an understanding of power analysis.